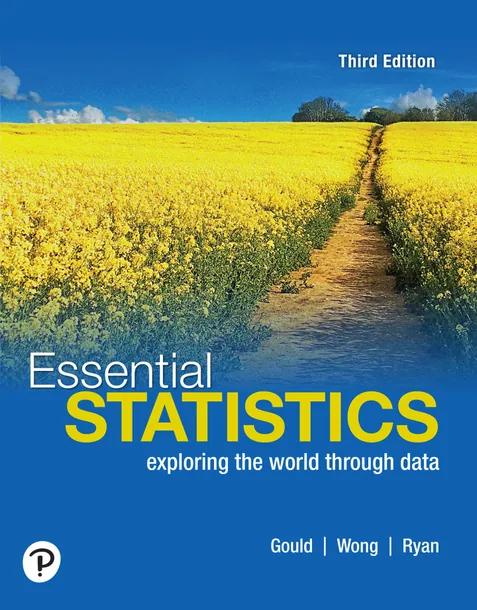
Essential Statistics
by Robert N. Gould, Rebecca Wong, Colleen Ryan
3rd Edition
Publisher: Pearson
Book Details
| Print ISBN | 9780135760284 |
| eText ISBN | 9780136570752 |
| Publisher | Pearson |
| Publishing Year | 2021 |
| Edition | 3rd Edition |
| Language | English |
| Pages | 608 |
Essential Statistics, 3rd Edition, is a Pearson textbook designed for one-semester introductory statistics courses. The work presents foundational principles for exploring data, evaluating claims, and communicating quantitative results.
The volume addresses exploratory data analysis, covering data collection, graphical representations of variation, and numerical summaries. It also explores probability models, linear regression, survey sampling, and inferential methods for population proportions and means.
Informed by the Guidelines for Assessment and Instruction in Statistics Education (GAISE), the 2021 edition incorporates features reflecting the growth of data science. The text can be paired with digital practice tools through MyLab Statistics and the StatCrunch web platform.
Table of Contents
Chapter 1: Introduction to Data
- • Case Study—Deadly Cell Phones?
- • 1.1 What Are Data?
- • 1.2 Classifying and Storing Data
- • 1.3 Organizing Categorical Data
- • 1.4 Collecting Data to Understand Causality
- • Data Project–How Are Data Stored?
Chapter 2: Picturing Variation with Graphs
- • Case Study—Student-to-Teacher Ratio at Colleges
- • 2.1 Visualizing Variation in Numerical Data
- • 2.2 Summarizing Important Features of a Numerical Distribution
- • 2.3 Visualizing Variation in Categorical Variables
- • 2.4 Summarizing Categorical Distributions
- • 2.5 Interpreting Graphs
- • Data Project–Asking Questions
Chapter 3: Numerical Summaries of Center and Variation
- • Case Study—Living in a Risky World
- • 3.1 Summaries for Symmetric Distributions
- • 3.2 What’s Unusual? The Empirical Rule and z-Scores
- • 3.3 Summaries for Skewed Distributions
- • 3.4 Comparing Measures of Center
- • 3.5 Using Boxplots for Displaying Summaries
- • Data Project–The Statistical Investigation Cycle
Chapter 4: Regression Analysis: Exploring Associations between Variables
- • Case Study—Forecasting Home Prices
- • 4.1 Visualizing Variability with a Scatterplot
- • 4.2 Measuring Strength of Association with Correlation
- • 4.3 Modeling Linear Trends
- • 4.4 Evaluating the Linear Model
- • Data Project–Data Moves
Chapter 5: Modeling Variation with Probability
- • Case Study—SIDS or Murder?
- • 5.1 What Is Randomness?
- • 5.2 Finding Theoretical Probabilities
- • 5.3 Associations in Categorical Variables
- • 5.4 Finding Empirical Probabilities
- • Data Project–Submitting Data
Chapter 6: Modeling Random Events: The Normal and Binomial Models
- • Case Study—You Sometimes Get More Than You Pay For
- • 6.1 Probability Distributions Are Models of Random Experiments
- • 6.2 The Normal Model
- • 6.3 The Binomial Model (optional)
- • Data Project–Generating Random Numbers
Chapter 7: Survey Sampling and Inference
- • Case Study—Spring Break Fever: Just What the Doctors Ordered?
- • 7.1 Learning about the World through Surveys
- • 7.2 Measuring the Quality of a Survey
- • 7.3 The Central Limit Theorem for Sample Proportions
- • 7.4 Estimating the Population Proportion with Confidence Intervals
- • 7.5 Comparing Two Population Proportions with Confidence
- • Data Project–Population Proportions
Chapter 8: Hypothesis Testing for Population Proportions
- • Case Study—Dodging the Question
- • 8.1 The Essential Ingredients of Hypothesis Testing
- • 8.2 Hypothesis Testing in Four Steps
- • 8.3 Hypothesis Tests in Detail
- • 8.4 Comparing Proportions from Two Populations
- • Data Project–Dates as Data
Chapter 9: Inferring Population Means
- • Case Study—You Look Sick! Are You Sick?
- • 9.1 Sample Means of Random Samples
- • 9.2 The Central Limit Theorem for Sample Means
- • 9.3 Answering Questions about the Mean of a Population
- • 9.4 Hypothesis Testing for Means
- • 9.5 Comparing Two Population Means
- • 9.6 Overview of Analyzing Means
- • Data Project–Data Structures
Chapter 10: Analyzing Categorical Variables and Interpreting Research
- • Case Study—Popping Better Popcorn
- • 10.1 The Basic Ingredients for Testing with Categorical Variables
- • 10.2 Chi-Square Tests for Associations between Categorical Variables
- • 10.3 Reading Research Papers
- • Data Project–Think Small
Chapter Appendix A: Tables
Chapter Appendix B: Check Your Tech Answers
Chapter Appendix C: Credits
Customer Reviews
0.0
0 reviews
No reviews yet. Be the first to review this book!
Write a Review
Reviewed by GradeFocus Editorial Team
▶Research Sources (3)
Related Books
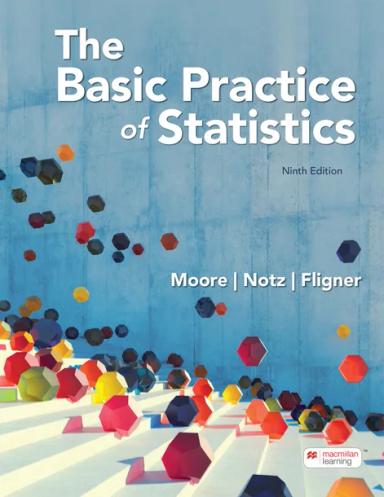
The Basic Practice of Statistics
David S. Moore
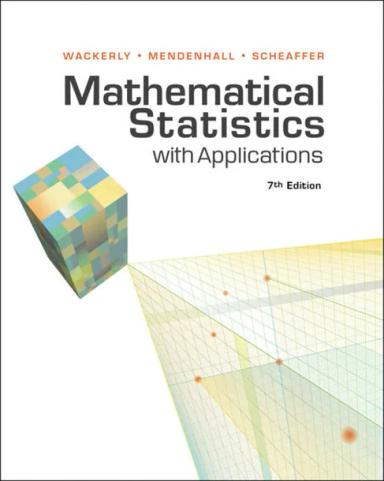
Mathematical Statistics with Applications
Dennis Wackerly
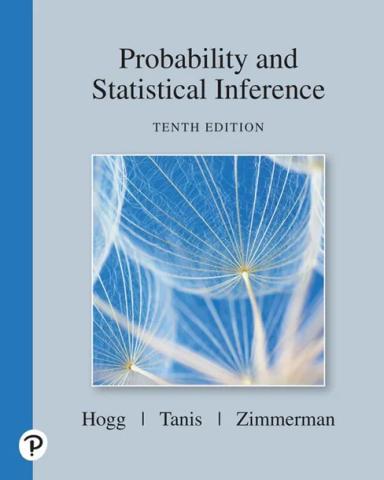
Probability and Statistical Inference
Robert V. Hogg
Essentials of Statistics for the Behavioral Sciences
Frederick J Gravetter
The Practice of Statistics for the AP® Course
Daren Starnes
The Practice of Statistics for the AP® Course
Daren Starnes